Your Guide to New York Professional Requirements

The number of STD cases in the United States has been surging over the past few years, with more than 2 million cases of chlamydia, gonorrhea, and syphilis diagnosed in 2020. According to the CDC, STD rates have reached an all-time high and the progress the agency had made to control the spread of STDs has “unraveled.” Less than 20 years ago, the number of new STD cases was far lower, with chlamydia being easier to detect, gonorrhea rates at historic lows, and syphilis close to being eliminated.
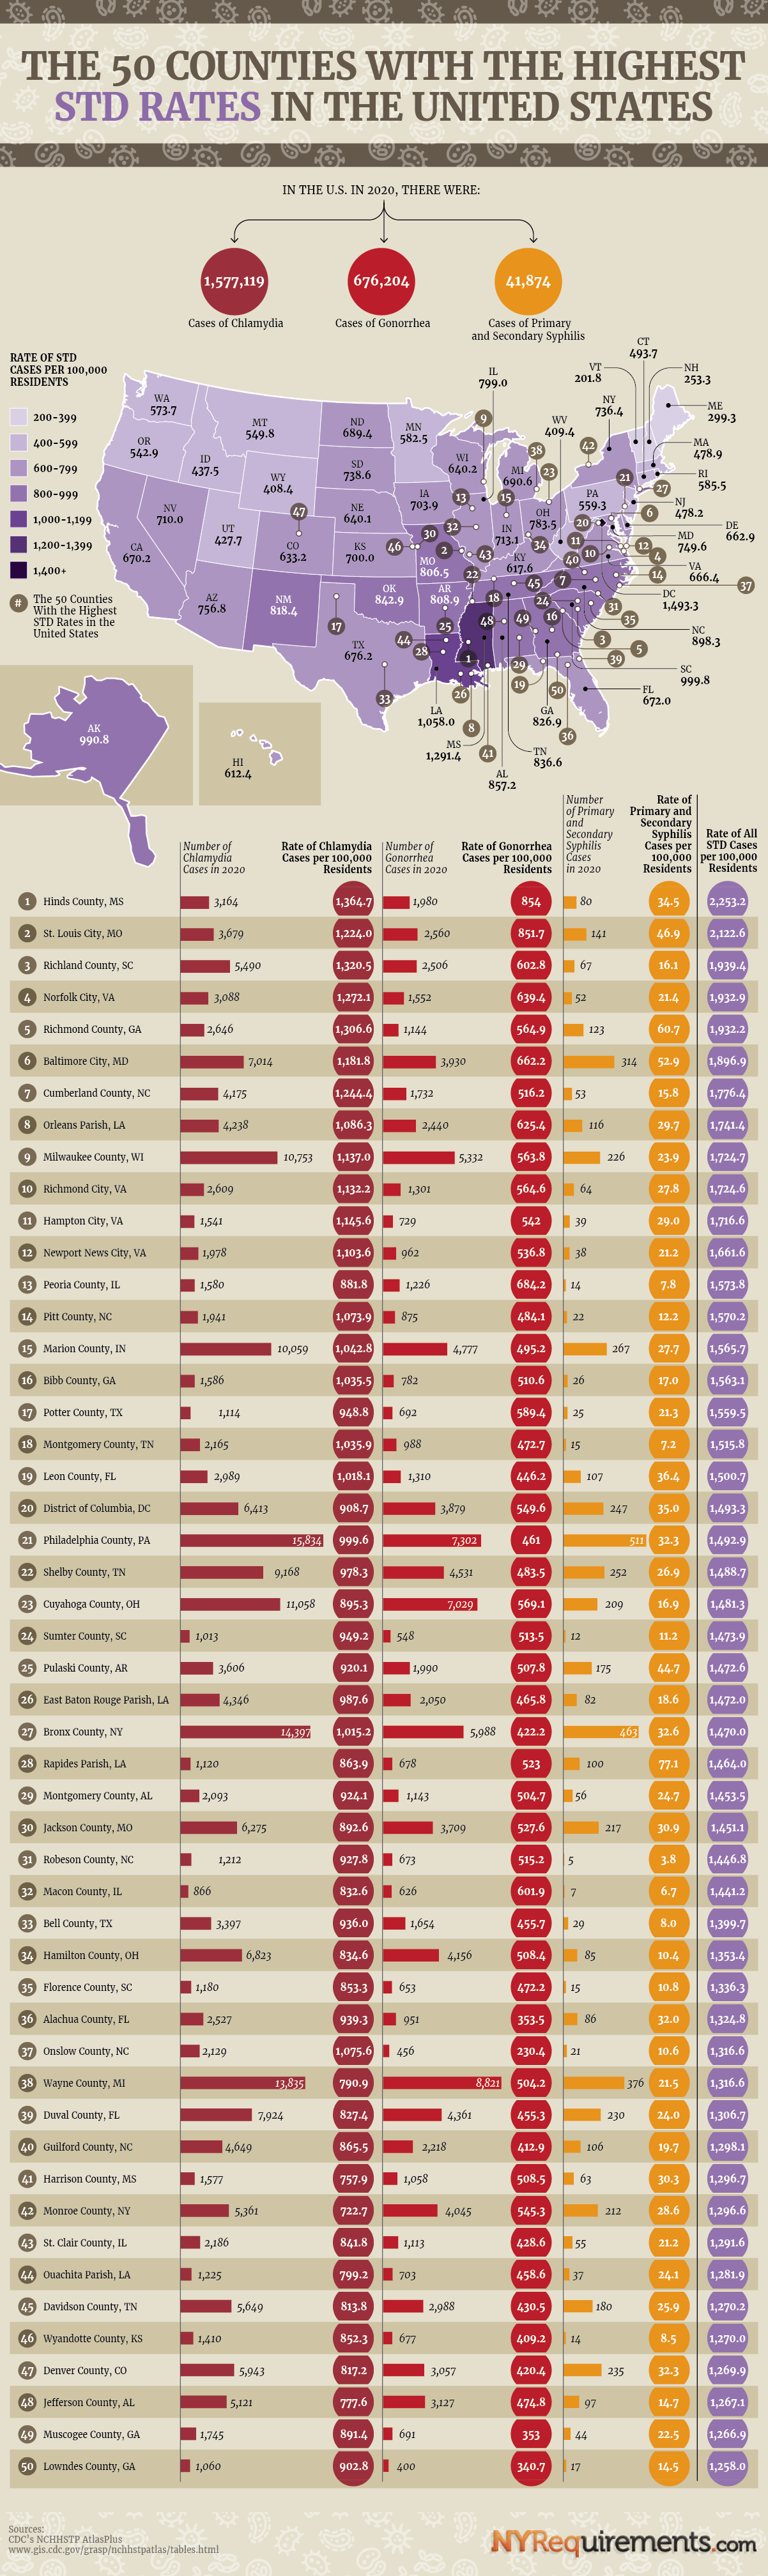
The team at NYRequirements.com wanted to know if certain areas of the country were being hit harder by this uptick in common STDs. Using county data collected through the CDC’s NCHHSTP AtlasPlus, our team analyzed the rates of the most common STDs in the U.S. to determine the 50 counties with the highest rate of all STDs per 100,000 residents. Only counties with 100,000 residents or more were included in this analysis. The list of STDs includes chlamydia, gonorrhea, and primary and secondary syphilis. Chlamydia was found to be the most common STD of the three, with more than 1.5 million cases of chlamydia diagnosed in 2020.
What is the STD capital of America? Read on to find out.
Click here to download the printable PDF version of the chart.
Which U.S. County Has the Highest STD Rate?
The county with the highest STD rate in the U.S. is Hinds County, Mississippi, where the state capital, Jackson, is located. Hinds County, MS, has an STD rate of 2,253.2 cases per 100,000 residents.
The 10 Counties With the Highest STD Rates per 100,000 residents
- Hinds County, MS: 2,253.2
- St. Louis City, MO: 2,122.6
- Richland County, SC: 1,939.4
- Norfolk City, VA: 1,932.9
- Richmond County, GA: 1,932.2
- Baltimore City, MD: 1,896.9
- Cumberland County, NC: 1,776.4
- Orleans Parish, LA: 1,741.4
- Milwaukee County, WI: 1,724.7
- ?Richmond City, VA: 1,724.6
Which State Has the Highest STD Rate?
The state with the highest STD rate is Mississippi, with a rate of 1,291.4 STD cases per 100,000 state residents. The STD rates by state range from Mississippi's high of 1,291.4 to Vermont’s low STD rate of 201.8 cases per 100,000 residents.
While the District of Columbia isn’t technically a state, it’s still worth mentioning due to having the worst STD rate in the country, with 1,493.3 cases per 100,000 residents.
The 10 States With the Highest STD Rates (per 100,000 residents)
- Mississippi: 1,291.4
- Louisiana: 1,058.0
- South Carolina: 999.8
- Alaska: 990.8
- North Carolina: 898.3
- Alabama: 857.2
- Oklahoma: 842.9
- Tennessee: 836.6
- Georgia: 826.9
- ?New Mexico: 818.4
What Is the Most Common STD?
Chlamydia is the most common STD in the U.S. In 2020, 1.577 million cases of chlamydia were reported to the CDC. This amounts to an STD rate of 610.6 per 100,000 adults in the U.S. Of the top three types of STDs that are reported, chlamydia makes up 68.7% of the total cases.
In the U.S. in 2020, there were:
- 1,577,119 cases of chlamydia
- 676,204 cases of gonorrhea
- 41,874 cases of primary and secondary syphilis
If you’re wondering how to get tested for STDs, the CDC makes it easy to find free and confidential testing sites near you. Sexually transmitted infection control is an important aspect of maintaining the health of our society.
The STD Rate in Each U.S. State
|
State |
Rate of STD Cases per 100,000 Residents |
|
District of Columbia |
1,493.3 |
|
Mississippi |
1,291.4 |
|
Louisiana |
1,058.0 |
|
South Carolina |
999.8 |
|
Alaska |
990.8 |
|
North Carolina |
898.3 |
|
Alabama |
857.2 |
|
Oklahoma |
842.9 |
|
Tennessee |
836.6 |
|
Georgia |
826.9 |
|
New Mexico |
818.4 |
|
Arkansas |
808.9 |
|
Missouri |
806.5 |
|
Illinois |
799.0 |
|
Ohio |
783.5 |
|
Arizona |
756.8 |
|
Maryland |
749.6 |
|
South Dakota |
738.6 |
|
New York |
736.4 |
|
Indiana |
713.1 |
|
Nevada |
710.0 |
|
Iowa |
703.9 |
|
Kansas |
700.0 |
|
Michigan |
690.6 |
|
North Dakota |
689.4 |
|
Texas |
676.2 |
|
Florida |
672.0 |
|
California |
670.2 |
|
Virginia |
666.4 |
|
Delaware |
662.9 |
|
Wisconsin |
640.2 |
|
Nebraska |
640.1 |
|
Colorado |
633.2 |
|
Kentucky |
617.6 |
|
Hawaii |
612.4 |
|
Rhode Island |
585.5 |
|
Minnesota |
582.5 |
|
Washington |
573.7 |
|
Pennsylvania |
559.3 |
|
Montana |
549.8 |
|
Oregon |
542.9 |
|
Connecticut |
493.7 |
|
Massachusetts |
478.9 |
|
New Jersey |
478.2 |
|
Idaho |
437.5 |
|
Utah |
427.7 |
|
West Virginia |
409.4 |
|
Wyoming |
408.4 |
|
Maine |
299.3 |
|
New Hampshire |
253.3 |
|
Vermont |
201.8 |
The 50 Counties With the Highest STD Rates in the United States
|
Rank |
County |
Number of Chlamydia Cases in 2020 |
Rate of Chlamydia Cases per 100,000 Residents |
Number of Gonorrhea Cases in 2020 |
Rate of Gonorrhea Cases per 100,000 Residents |
Number of Primary and Secondary Syphilis Cases in 2020 |
Rate of Primary and Secondary Syphilis Cases per 100,000 Residents |
Rate of All STD Cases per 100,000 Residents |
|
1 |
Hinds County, MS |
3,164 |
1,364.7 |
1,980 |
854 |
80 |
34.5 |
2,253.2 |
|
2 |
St. Louis City, MO |
3,679 |
1,224.0 |
2,560 |
851.7 |
141 |
46.9 |
2,122.6 |
|
3 |
Richland County, SC |
5,490 |
1,320.5 |
2,506 |
602.8 |
67 |
16.1 |
1,939.4 |
|
4 |
Norfolk City, VA |
3,088 |
1,272.1 |
1,552 |
639.4 |
52 |
21.4 |
1,932.9 |
|
5 |
Richmond County, GA |
2,646 |
1,306.6 |
1,144 |
564.9 |
123 |
60.7 |
1,932.2 |
|
6 |
Baltimore City, MD |
7,014 |
1,181.8 |
3,930 |
662.2 |
314 |
52.9 |
1,896.9 |
|
7 |
Cumberland County, NC |
4,175 |
1,244.4 |
1,732 |
516.2 |
53 |
15.8 |
1,776.4 |
|
8 |
Orleans Parish, LA |
4,238 |
1,086.3 |
2,440 |
625.4 |
116 |
29.7 |
1,741.4 |
|
9 |
Milwaukee County, WI |
10,753 |
1,137.0 |
5,332 |
563.8 |
226 |
23.9 |
1,724.7 |
|
10 |
Richmond City, VA |
2,609 |
1,132.2 |
1,301 |
564.6 |
64 |
27.8 |
1,724.6 |
|
11 |
Hampton City, VA |
1,541 |
1,145.6 |
729 |
542 |
39 |
29.0 |
1,716.6 |
|
12 |
Newport News City, VA |
1,978 |
1,103.6 |
962 |
536.8 |
38 |
21.2 |
1,661.6 |
|
13 |
Peoria County, IL |
1,580 |
881.8 |
1,226 |
684.2 |
14 |
7.8 |
1,573.8 |
|
14 |
Pitt County, NC |
1,941 |
1,073.9 |
875 |
484.1 |
22 |
12.2 |
1,570.2 |
|
15 |
Marion County, IN |
10,059 |
1,042.8 |
4,777 |
495.2 |
267 |
27.7 |
1,565.7 |
|
16 |
Bibb County, GA |
1,586 |
1,035.5 |
782 |
510.6 |
26 |
17.0 |
1,563.1 |
|
17 |
Potter County, TX |
1,114 |
948.8 |
692 |
589.4 |
25 |
21.3 |
1,559.5 |
|
18 |
Montgomery County, TN |
2,165 |
1,035.9 |
988 |
472.7 |
15 |
7.2 |
1,515.8 |
|
19 |
Leon County, FL |
2,989 |
1,018.1 |
1,310 |
446.2 |
107 |
36.4 |
1,500.7 |
|
20 |
District of Columbia, DC |
6,413 |
908.7 |
3,879 |
549.6 |
247 |
35.0 |
1,493.3 |
|
21 |
Philadelphia County, PA |
15,834 |
999.6 |
7,302 |
461 |
511 |
32.3 |
1,492.9 |
|
22 |
Shelby County, TN |
9,168 |
978.3 |
4,531 |
483.5 |
252 |
26.9 |
1,488.7 |
|
23 |
Cuyahoga County, OH |
11,058 |
895.3 |
7,029 |
569.1 |
209 |
16.9 |
1,481.3 |
|
24 |
Sumter County, SC |
1,013 |
949.2 |
548 |
513.5 |
12 |
11.2 |
1,473.9 |
|
25 |
Pulaski County, AR |
3,606 |
920.1 |
1,990 |
507.8 |
175 |
44.7 |
1,472.6 |
|
26 |
East Baton Rouge Parish, LA |
4,346 |
987.6 |
2,050 |
465.8 |
82 |
18.6 |
1,472.0 |
|
27 |
Bronx County, NY |
14,397 |
1,015.2 |
5,988 |
422.2 |
463 |
32.6 |
1,470.0 |
|
28 |
Rapides Parish, LA |
1,120 |
863.9 |
678 |
523 |
100 |
77.1 |
1,464.0 |
|
29 |
Montgomery County, AL |
2,093 |
924.1 |
1,143 |
504.7 |
56 |
24.7 |
1,453.5 |
|
30 |
Jackson County, MO |
6,275 |
892.6 |
3,709 |
527.6 |
217 |
30.9 |
1,451.1 |
|
31 |
Robeson County, NC |
1,212 |
927.8 |
673 |
515.2 |
5 |
3.8 |
1,446.8 |
|
32 |
Macon County, IL |
866 |
832.6 |
626 |
601.9 |
7 |
6.7 |
1,441.2 |
|
33 |
Bell County, TX |
3,397 |
936.0 |
1,654 |
455.7 |
29 |
8.0 |
1,399.7 |
|
34 |
Hamilton County, OH |
6,823 |
834.6 |
4,156 |
508.4 |
85 |
10.4 |
1,353.4 |
|
35 |
Florence County, SC |
1,180 |
853.3 |
653 |
472.2 |
15 |
10.8 |
1,336.3 |
|
36 |
Alachua County, FL |
2,527 |
939.3 |
951 |
353.5 |
86 |
32.0 |
1,324.8 |
|
38 |
Onslow County, NC |
2,129 |
1,075.6 |
456 |
230.4 |
21 |
10.6 |
1,316.6 |
|
37 |
Wayne County, MI |
13,835 |
790.9 |
8,821 |
504.2 |
376 |
21.5 |
1,316.6 |
|
39 |
Duval County, FL |
7,924 |
827.4 |
4,361 |
455.3 |
230 |
24.0 |
1,306.7 |
|
40 |
Guilford County, NC |
4,649 |
865.5 |
2,218 |
412.9 |
106 |
19.7 |
1,298.1 |
|
41 |
Harrison County, MS |
1,577 |
757.9 |
1,058 |
508.5 |
63 |
30.3 |
1,296.7 |
|
42 |
Monroe County, NY |
5,361 |
722.7 |
4,045 |
545.3 |
212 |
28.6 |
1,296.6 |
|
43 |
St. Clair County, IL |
2,186 |
841.8 |
1,113 |
428.6 |
55 |
21.2 |
1,291.6 |
|
44 |
Ouachita Parish, LA |
1,225 |
799.2 |
703 |
458.6 |
37 |
24.1 |
1,281.9 |
|
45 |
Davidson County, TN |
5,649 |
813.8 |
2,988 |
430.5 |
180 |
25.9 |
1,270.2 |
|
46 |
Wyandotte County, KS |
1,410 |
852.3 |
677 |
409.2 |
14 |
8.5 |
1,270.0 |
|
47 |
Denver County, CO |
5,943 |
817.2 |
3,057 |
420.4 |
235 |
32.3 |
1,269.9 |
|
48 |
Jefferson County, AL |
5,121 |
777.6 |
3,127 |
474.8 |
97 |
14.7 |
1,267.1 |
|
49 |
Muscogee County, GA |
1,745 |
891.4 |
691 |
353 |
44 |
22.5 |
1,266.9 |
|
50 |
Lowndes County, GA |
1,060 |
902.8 |
400 |
340.7 |
17 |
14.5 |
1,258.0 |