Your Guide to New York Professional Requirements

Child abuse is a hidden epidemic that is happening around the globe, and the United States is no exception. In fact, out of all of the industrialized nations, the U.S. has one of the worst records of child abuse. According to child abuse statistics shared by the nonprofit Childhelp, a report of child abuse is made every ten seconds in the United States.
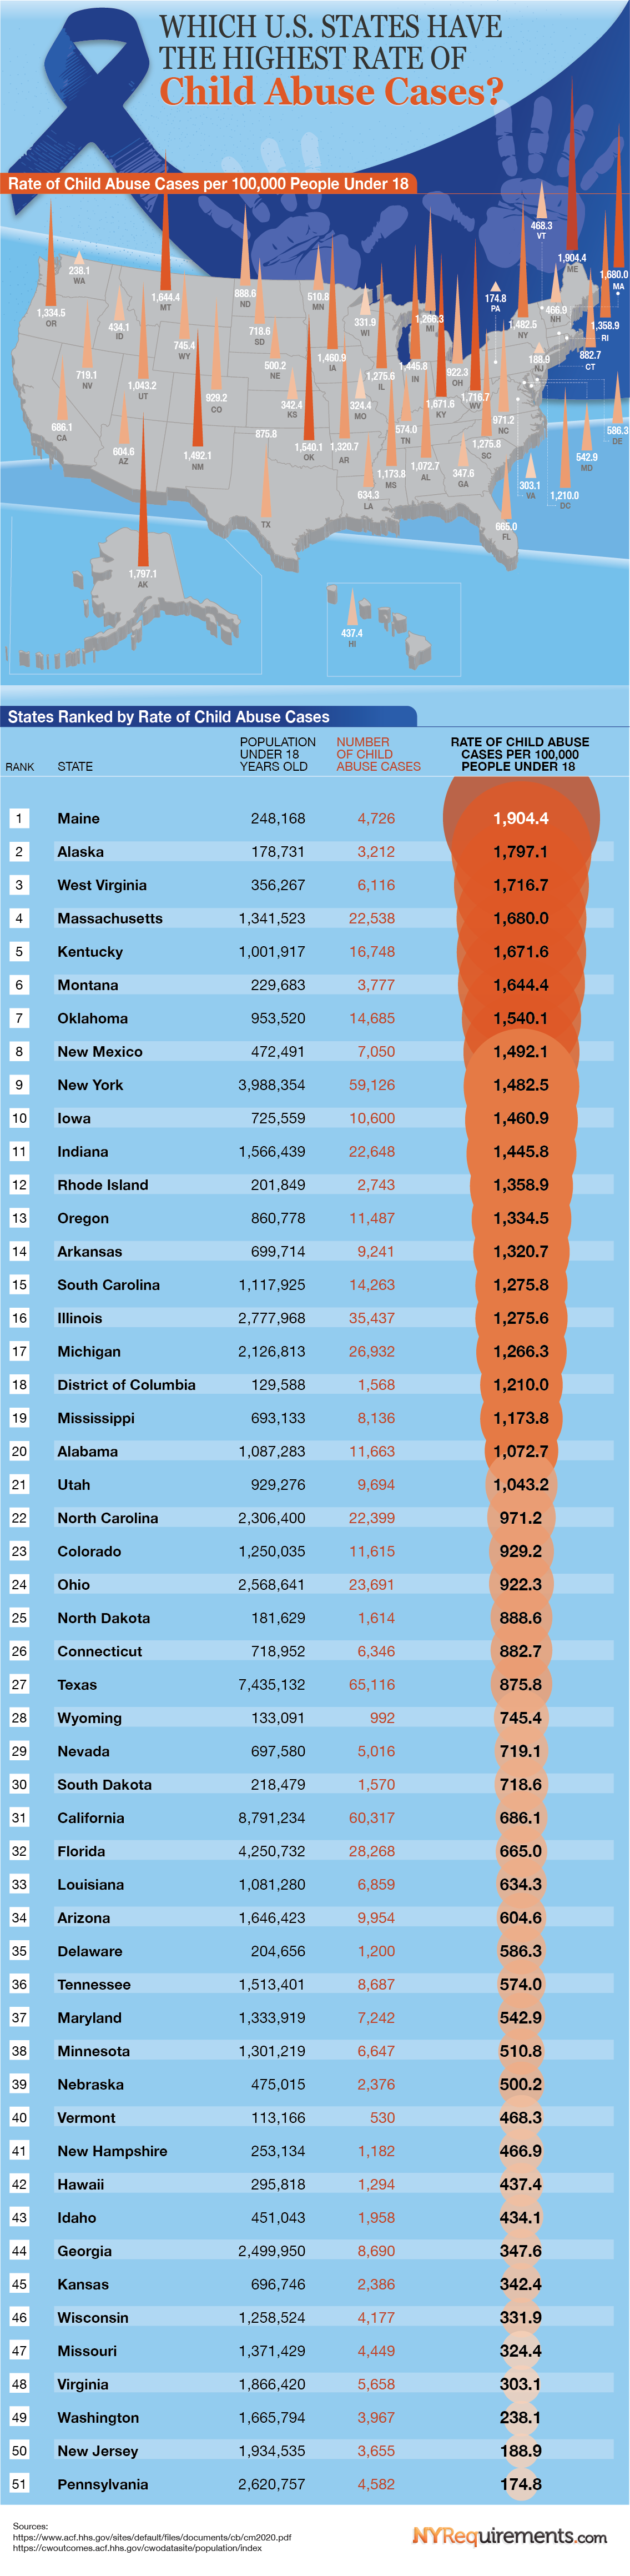
Where in the U.S. are children suffering the most from abuse? NY Requirements put together this visual to determine which states have the highest rates of child abuse cases. Our team pulled data from the Child Maltreatment 2020 report compiled by the Children’s Bureau of the U.S. Department of Health and Human Services to find the number of child victims in each state in 2020. The number of victims was then compared to the total number of people under the age of 18 who reside in the state to find the rate of child abuse cases in each state. While these child abuse facts are eye-opening, it’s an important statistic to highlight to bring more awareness to the child abuse epidemic that is occurring across the United States. Would you recognize the signs of child abuse if they were in front of you?
Click here to download the printable PDF version of the chart.
Which State Has the Highest Rate of Child Abuse Cases?
The state with the highest rate of child abuse cases is Maine, where 1,904.4 children are victims of child abuse out of every 100,000 people under the age of 18 in the state. The number of child abuse cases in Maine has been steadily increasing over the past few years, with the number of child abuse cases between 2019 and 2020 rising 37%. There were 248,168 people under the age of 18 in Maine in 2020, and 4,726 of them were victims of child abuse.
Even though Maine was found to have the highest rate of child abuse in 2020, Kentucky held the top spot for the worst child abuse cases rate for the three years prior. The number of child abuse cases in Kentucky decreased 16.3% between 2019 and 2020.
The 10 States With the Highest Rate of Child Abuse Cases per 100,000 People Under 18
- Maine: 1,904.4
- Alaska: 1,797.1
- West Virginia: 1,716.7
- Massachusetts: 1,680.0
- Kentucky: 1,671.6
- Montana: 1,644.4
- Oklahoma: 1,540.1
- New Mexico: 1,492.1
- New York: 1,482.5
- Iowa: 1,460.9
Which State Has the Lowest Rate of Child Abuse Cases?
The state with the lowest rate of child abuse cases is Pennsylvania, with a rate of 174.8 cases for every 100,000 people under the age of 18 in the state. Pennsylvania has 2.62 million people under the age of 18, and less than 5,000 cases of child abuse have been reported over each of the past four years, with the number of victims decreasing 5.2% in 2020.
New Jersey was a close second, with a low rate of 188.9 child abuse cases per 100,000 children in the state. New Jersey was also found to have the biggest decrease in the number of child abuse cases, with a 55.8% reduction in the number of victims between 2019 and 2020.
The 10 States With the Lowest Rate of Child Abuse Cases per 100,000 People Under 18
- Pennsylvania: 174.8
- New Jersey: 188.9
- Washington: 238.1
- Virginia: 303.1
- Missouri: 324.4
- Wisconsin: 331.9
- Kansas: 342.4
- Georgia: 347.6
- Idaho: 434.1
- Hawaii: 437.4
Which State Had the Biggest Increase in Child Abuse Cases?
One state stands out from the rest due to its monstrous increase in the number of child abuse victims between 2019 and 2020. According to the child abuse statistics compiled by Childhelp, North Carolina had an increase of 214% in its number of child abuse cases. The number of victims reported in 2019 was 5,601 and rose to 22,399 in 2020. No other state’s increase in child abuse victims even comes close to North Carolina’s. Maine’s 37% increase in the number of child abuse victims was the second largest increase in the country.
If you work with children, are a social worker, or are a medical professional in New York, you may be required to complete mandated reporter training to help you identify and stop child abuse and neglect. Our course follows the required curriculum and materials provided in the mandated reporter trainer resource guide, including identifying the different types of child abuse and reporting any signs of child abuse and maltreatment/neglect.
Rate of Child Abuse Cases per 100,000 People Under 18 in Every U.S. State
|
|
State |
Population Under 18 Years Old |
Number of Child Abuse Cases |
Rate of Child Abuse Cases per 100,000 People Under 18 |
|
1 |
Maine |
248,168 |
4,726 |
1,904.4 |
|
2 |
Alaska |
178,731 |
3,212 |
1,797.1 |
|
3 |
West Virginia |
356,267 |
6,116 |
1,716.7 |
|
4 |
Massachusetts |
1,341,523 |
22,538 |
1,680.0 |
|
5 |
Kentucky |
1,001,917 |
16,748 |
1,671.6 |
|
6 |
Montana |
229,683 |
3,777 |
1,644.4 |
|
7 |
Oklahoma |
953,520 |
14,685 |
1,540.1 |
|
8 |
New Mexico |
472,491 |
7,050 |
1,492.1 |
|
9 |
New York |
3,988,354 |
59,126 |
1,482.5 |
|
10 |
Iowa |
725,559 |
10,600 |
1,460.9 |
|
11 |
Indiana |
1,566,439 |
22,648 |
1,445.8 |
|
12 |
Rhode Island |
201,849 |
2,743 |
1,358.9 |
|
13 |
Oregon |
860,778 |
11,487 |
1,334.5 |
|
14 |
Arkansas |
699,714 |
9,241 |
1,320.7 |
|
15 |
South Carolina |
1,117,925 |
14,263 |
1,275.8 |
|
16 |
Illinois |
2,777,968 |
35,437 |
1,275.6 |
|
17 |
Michigan |
2,126,813 |
26,932 |
1,266.3 |
|
18 |
District of Columbia |
129,588 |
1,568 |
1,210.0 |
|
19 |
Mississippi |
693,133 |
8,136 |
1,173.8 |
|
20 |
Alabama |
1,087,283 |
11,663 |
1,072.7 |
|
21 |
Utah |
929,276 |
9,694 |
1,043.2 |
|
22 |
North Carolina |
2,306,400 |
22,399 |
971.2 |
|
23 |
Colorado |
1,250,035 |
11,615 |
929.2 |
|
24 |
Ohio |
2,568,641 |
23,691 |
922.3 |
|
25 |
North Dakota |
181,629 |
1,614 |
888.6 |
|
26 |
Connecticut |
718,952 |
6,346 |
882.7 |
|
27 |
Texas |
7,435,132 |
65,116 |
875.8 |
|
28 |
Wyoming |
133,091 |
992 |
745.4 |
|
29 |
Nevada |
697,580 |
5,016 |
719.1 |
|
30 |
South Dakota |
218,479 |
1,570 |
718.6 |
|
31 |
California |
8,791,234 |
60,317 |
686.1 |
|
32 |
Florida |
4,250,732 |
28,268 |
665.0 |
|
33 |
Louisiana |
1,081,280 |
6,859 |
634.3 |
|
34 |
Arizona |
1,646,423 |
9,954 |
604.6 |
|
35 |
Delaware |
204,656 |
1,200 |
586.3 |
|
36 |
Tennessee |
1,513,401 |
8,687 |
574.0 |
|
37 |
Maryland |
1,333,919 |
7,242 |
542.9 |
|
38 |
Minnesota |
1,301,219 |
6,647 |
510.8 |
|
39 |
Nebraska |
475,015 |
2,376 |
500.2 |
|
40 |
Vermont |
113,166 |
530 |
468.3 |
|
41 |
New Hampshire |
253,134 |
1,182 |
466.9 |
|
42 |
Hawaii |
295,818 |
1,294 |
437.4 |
|
43 |
Idaho |
451,043 |
1,958 |
434.1 |
|
44 |
Georgia |
2,499,950 |
8,690 |
347.6 |
|
45 |
Kansas |
696,746 |
2,386 |
342.4 |
|
46 |
Wisconsin |
1,258,524 |
4,177 |
331.9 |
|
47 |
Missouri |
1,371,429 |
4,449 |
324.4 |
|
48 |
Virginia |
1,866,420 |
5,658 |
303.1 |
|
49 |
Washington |
1,665,794 |
3,967 |
238.1 |
|
50 |
New Jersey |
1,934,535 |
3,655 |
188.9 |
|
51 |
Pennsylvania |
2,620,757 |
4,582 |
174.8 |